Dear SweepMe Team,
is it possible to run a measurement, close sweepme, re-start sweepme and then load the measured data from the last (or any) run for plotting and visualization?
Best regards
Dear SweepMe Team,
is it possible to run a measurement, close sweepme, re-start sweepme and then load the measured data from the last (or any) run for plotting and visualization?
Best regards
Hi Markus,
it not possible in the ideal way, meaning that you can recover exactly the state after the measurement has finished. Such a feature was already requested several times, but would require quite some changes to completely recover the state and is of our development power for now.
What you can do is using the ReadValues module. This can be used to load data from csv files, or Excel files.
If you select a SwepMe! measurement data file and run the progran, the data will be loaded into the data manager of SweepMe! and is then available in the Plot (but as variable of the ReadValues module).
In the latest version of the ReadValues module, you can select whether you like to make a sweep over each row/line of the file or readin the data as a list for each variable. In both cases you can plot the data afterwards. It only makes a difference when you like to post-process the data.
Basically, you can use SweepMe! also for evaluating data by first loading the data with the module ReadValues and then run Calc modules or CustomFunction modules to do further processing steps. This way it is also possible to use multiple ReadValues modules and load data from different sources. In this case, it would make sense to load data as a list for each variable, so that data from different sources is loaded in one step.
It is not possible yet to sweep over files (batch processing). We already have a module LoadFiles to define a number of file paths, but currently the module ReadValues does not support a handover of a parameter to dynamically change the file to be loaded during runtime.
So the simplest setting would be to just add a single ReadValues module to the sequencer.
What do you think? Is this something that already helps or are there any features missing to make this approach useful?
Thanks and best
Axel
Thank you Axel for your quick response. The original question came from me, it raised during a team discussion about SweepMe! features. We were exploring whether it’s possible to load measurement data, and potentially multiple datasets from previous runs, for comparison – and whether post-processing, as you described, would be possible. I had already noticed the LoadFiles module and was planning to test it. Your suggested approach using the ReadValues module, sounds promising and may well satisfy our current needs. I’ll definitely explore that.
Thanks for the help
Marc
Hi Again,
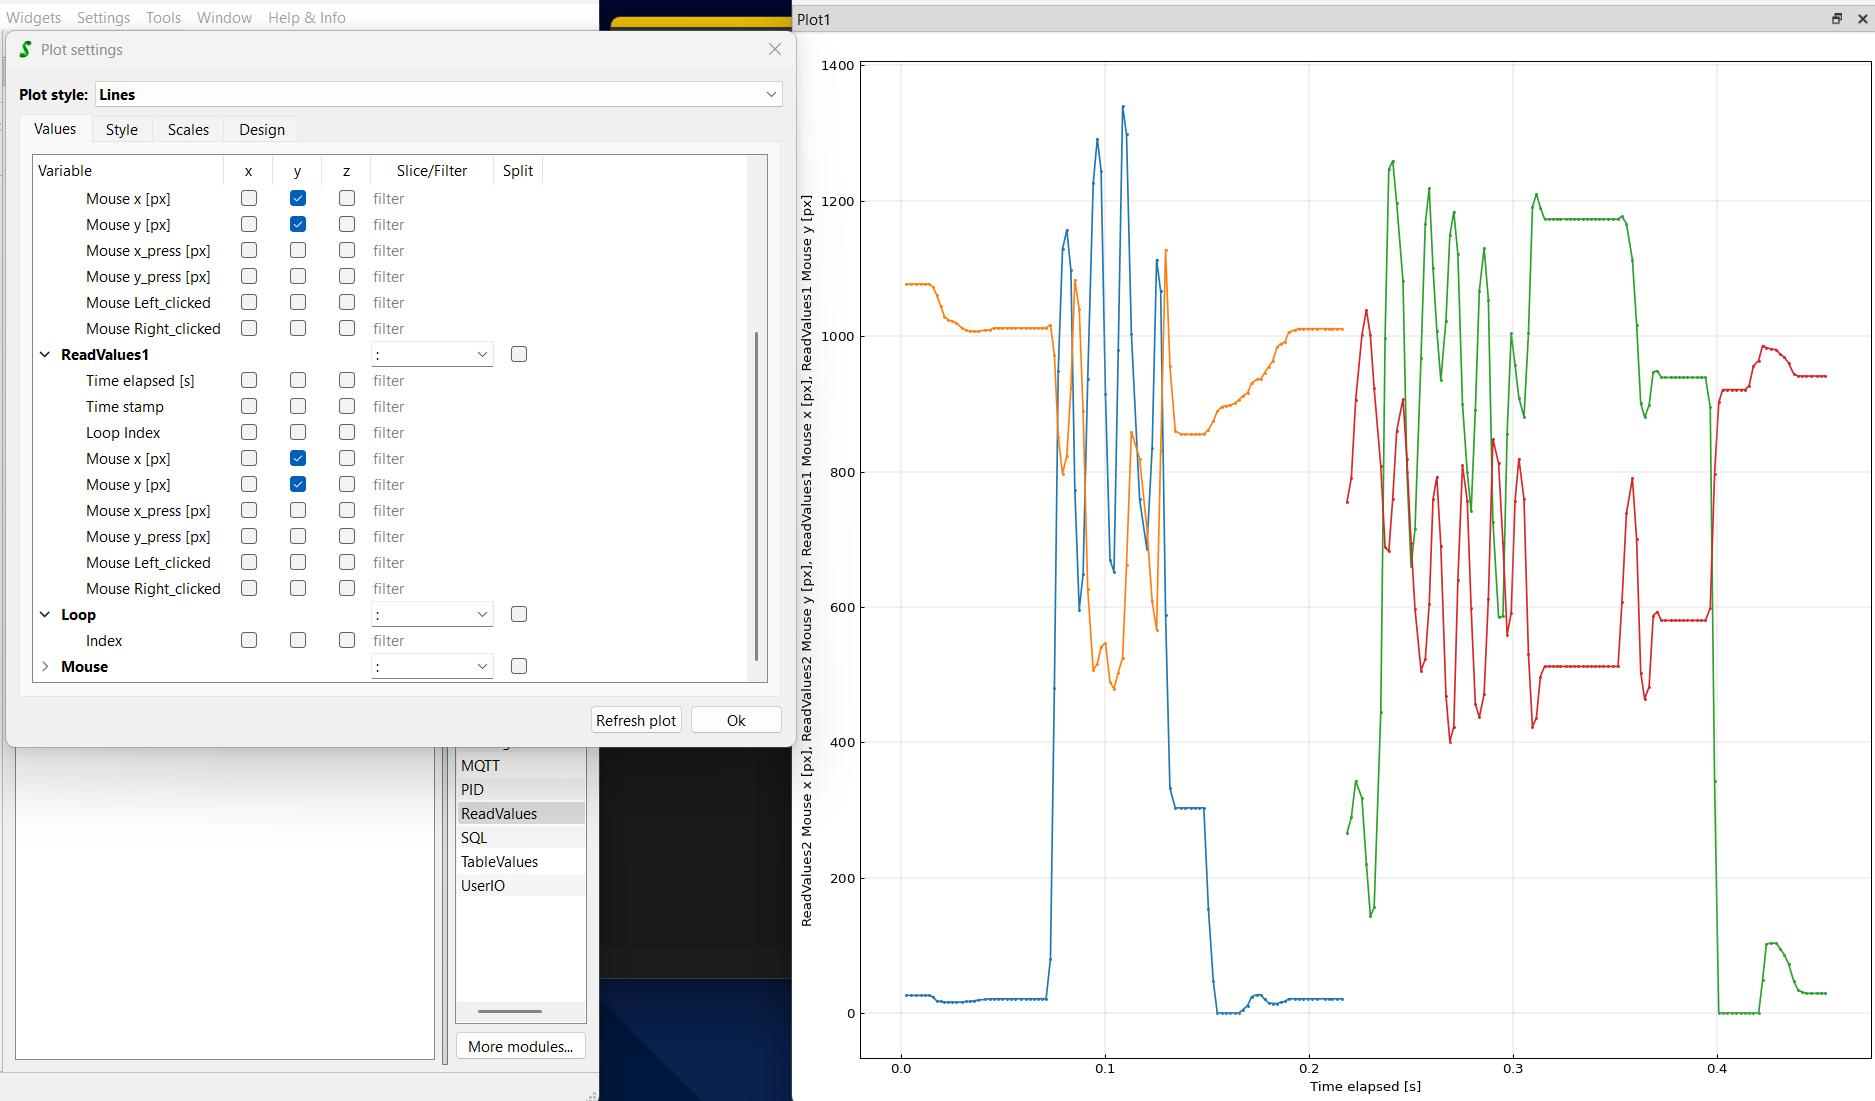
so I tested the readValues Module which seems to work excellent for this, but I found a Problem which I can’t solve at the moment. When I try to plot two measurements from different files, I can’t plot them overlapping, they always get plottet side by side. If I plot only one by A Time it seems looks okay. As x axis i chose the global elapsed Time in s. I also tested different parameters as x-axis but this was also the only one which I could use where all data was even plottet.
Thanks in adavance
Marc
Hi Marc,
this is indeed not that easy. The plot can so far accept only one x variable. So you can either use it from the one file or the other.
If both files have the same time stamps, one could use the times from one file also for the other, but if you use the variable “Time elapsed in s” I guess that they will not perfectly match and it would be incorrect.
It is possible to open two plots and add to each plot one data set to compare it, e.g. by using the same min/max value.
When I proposed to use two ReadValues modules to load data from two different files, I rather thought like you would like to do some post-processing by handing over the data to a CustomFunction script where you are then free to treat the as you like and return new x and y values of the evaluated data.
If you rather like use SweepMe! as a tool to quickly compare two sets of measurements, it might not be ideal yet. Our plot is missing a “layer” structure, where you could add another “Values”-tab like input matrix to select a second x value and corresponding y-values.
This is something that we cannot develop immediately, but typically try to put in funded R&D projects or in co-innovation projects with our customers.
Maybe you can also explain a bit more what you ultimate goal is, so I can better understand whether there are also other solutions.
Possible is already to write a CustomFunction script with a custom Dashboard widget that is plotting your data and where you can handover multiply x,y values. It would not be a very flexible widget as the plot cannot be easily changed/modified by some clicks, but it is something every user can do on their own.
We recently published all CustomFunction scripts on GitHub and there is one example that shows how to add a matplotlib Plot as a widget and feed it with data:
Thanks and best,
Axel