Display DataFrame to the user


Hi there,
I have written a custom function that extracts data from a database, which I want the user to see as background info for the current measurement.
I get the data from the database as a pandas-DataFrame. Now I’m struggeling to nicely display the data to the user.
The best I’ve managed so far is a table widget, which covers most of my needs.
(In order to use the widget, I have to split my DataFrame into columns and make lists out of them. I use these lists as outputs of my custom function.

But I have two issues with the table widget:

  1. The full label of the custom function is shown in every column. This makes reading the column headers difficult.
  2. I have some numbers in my data that are supposed to be in string format (i.e. “00” and “30”). The table widget takes my strings and turns them into floats (i.e. 0.0 and 30.0).

Is there any way to avoid these issues?
Or is there a better method than the table widget?

1 Like

Hi Felix,

thanks a lot for posting your questions here.

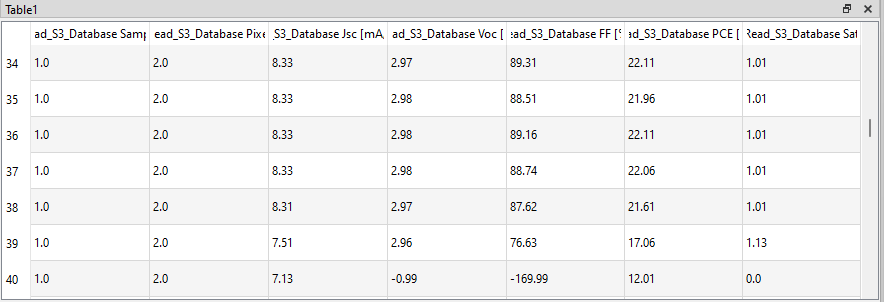
The Table widget can be a good widget to quickly present tabular data. However, it might be that it cannot fully customized to your needs.

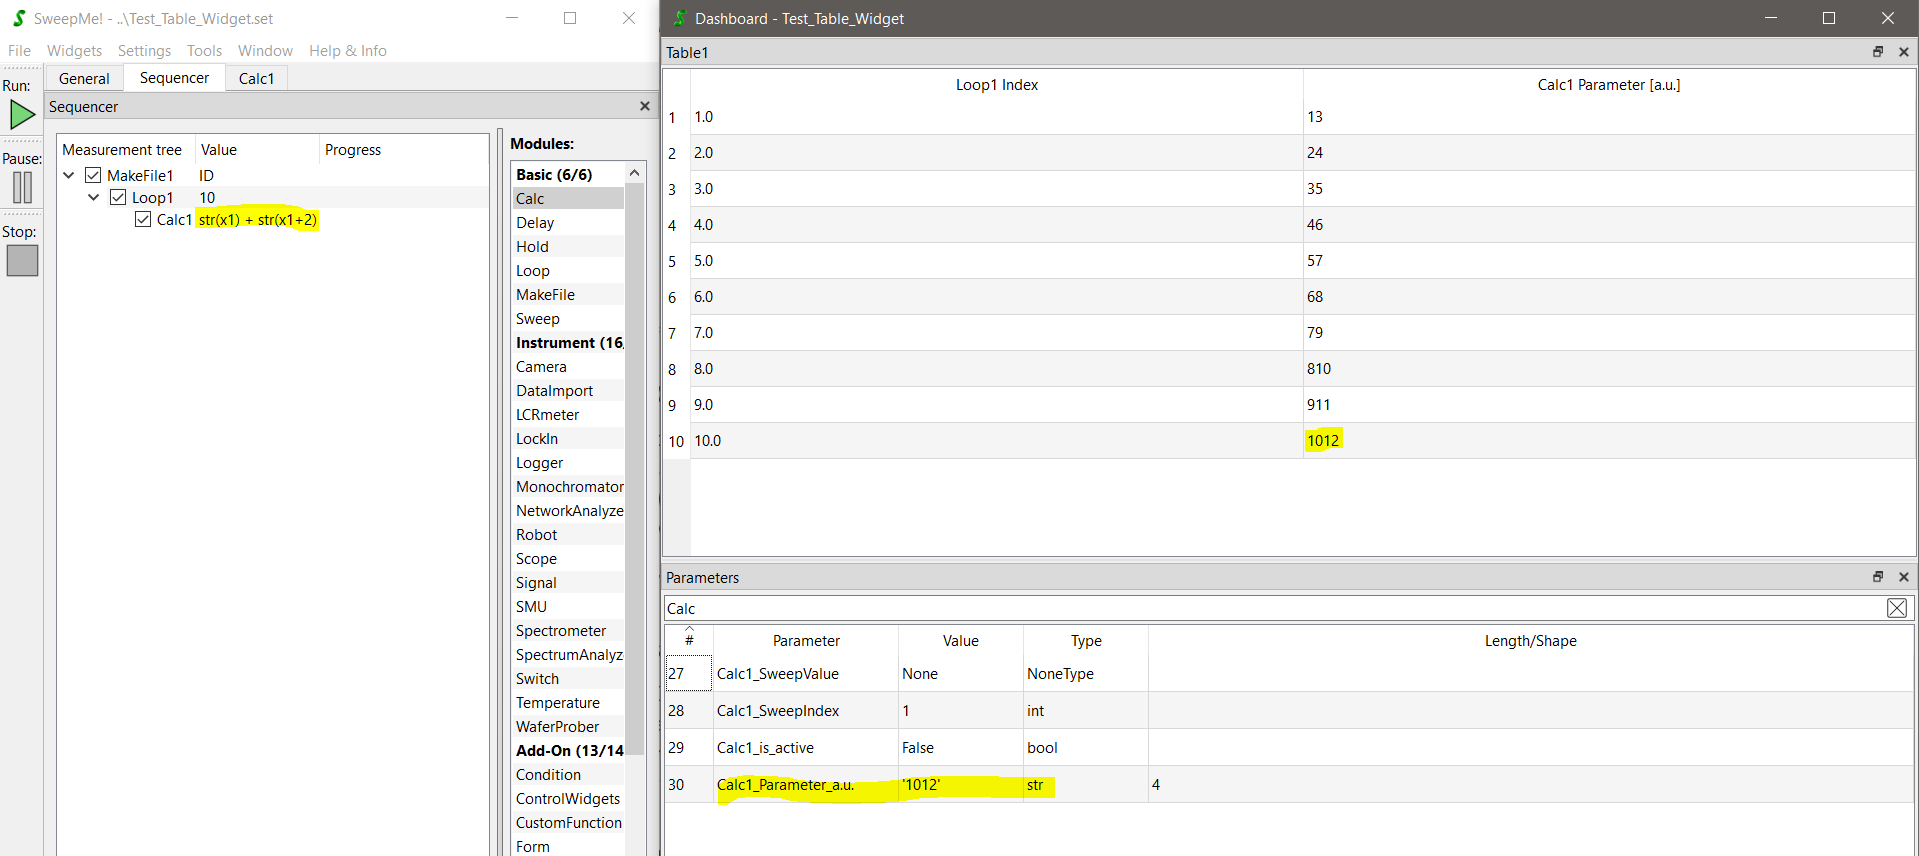
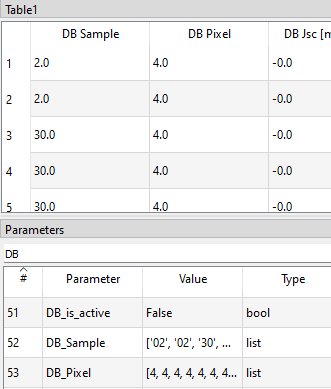
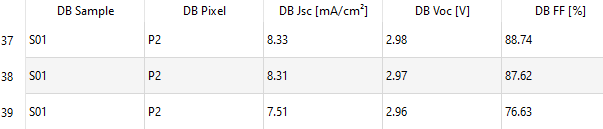
Regarding your first point, you could return the data from your CustomFunction script with different variable names. This way, you would also see shorter variable names in the table column headings.

Regarding the problem with the number formatting, we will try to reproduce this as all entries should be added as string without any further formatting.

In the best case, you could then use the Table widget as is.

If you need further customization, it is possible to create own widgets using the add-on module CustomFunction.

Please update to the latest version of the module and have a look at the at the example “GUI_Pass_Fail”. This script creates a PASS/FAIL widget. It is a good example how to create a widget using Qt5/PySide2 and link it to the main function of the CustomFunction script.

If you are new to creating UI with Qt5, we can recommend to just ask ChatGPT or similar Generative AI tools. Here is an example:

from PySide2 import QtWidgets, QtCore

class TableWidget(QtWidgets.QWidget):
    def __init__(self):
        super().__init__()
        
        self.layout = QtWidgets.QVBoxLayout(self)
        
        self.table = QtWidgets.QTableWidget(30, 10)  # 30 rows, 10 columns
        self.layout.addWidget(self.table)
        
        self.setLayout(self.layout)
    
    def set_column_content(self, column_index, content_list):
        """Sets the content of a specific column."""
        if 0 <= column_index < self.table.columnCount():
            for row_index, value in enumerate(content_list):
                if row_index < self.table.rowCount():
                    item = QtWidgets.QTableWidgetItem(str(value))
                    self.table.setItem(row_index, column_index, item)
        else:
            print("Invalid column index")
    
    def set_column_headers(self, headers):
        """Sets the column headers."""
        if len(headers) == self.table.columnCount():
            self.table.setHorizontalHeaderLabels(headers)
        else:
            print("Header list must match the number of columns")

(code not tested)

Copy this widget to your CustomFunction script and link it to your loaded data.

Please find further information how to enable the GUI mode in a CustomFunction script here:
https://wiki.sweep-me.net/wiki/CustomFunction#GUI_mode

Let me know whether further infos are needed.

Best, Axel

1 Like

Here is some test: A Loop module creates a 10-times repetition. A Calc module constructs a string out of the Loop index. This string is shown correctly in the Table widget.

The Parameters Widget also shows that the variables returned by Calc is a string with length 4 e.g. for the last item.

The only thing that makes me wonder is why Loop index is not shown as integer but rather as float with decimal point.

Maybe you could check whether the data in your DataFrame was converted to a number or an integer as in my case with the Loop module?

If I add many variables to the Table widget, I also have the problem that column names are too long to be shown correctly. Any suggestion how to handle long names, still ensuring the variable can be identified?

Thanks for testing! :slight_smile:

My column “DB_Samples” is a list of strings, but the table shows it as floats:


Can I avoid using a list?

1 Like

I guess we need to do some refinement of the Table widget to also handle lists correctly. I will add a backlog item and inform you once an update is available.

An alternative would be to create a loop over your CustomFunction module and returning just one value at the time.

Let me check whether we can quickly fix this as the combination of returning a list and displaying it in the Table widget is already a very good solution and going back to a custom solution would be against the SweepMe! philosophy if similar contents already exist.

Hi Felix,

we figured out the problem which is related to how data is internally stored in our data manager. While the Widget ‘Parameters’ just gives a snapshot of the last added value, the history of all data is saved in another format. When there are list of strings that can be converted to numbers, there is at the moment at automatic conversion to float. The same holds true for integers.

Please note that this does not affect how data is saved or visualized in the Plot. It however plays a role in the Table widget where the data type can be immediately seen.

We will change this but it will take some time to work on it.

In the meantime, you can do the following workaround. If you add any letter to your digit string like “Sample00” or “S00” you can force the system to keep it as string. Maybe you can pre-process your data that way before returning it.

Further, you can as described above always create your custom Table widget.

Regarding, the too long column heading names, I thought about introducing a horizontal scroll bar, but not sure whether this is the best solution as parts of the table would be always hidden. Another solution could be to align the names at the right side of the column so that at least the ending is readable.
Here, you could also pre-process your data in a way that variable names are shortened. For example. you could rename the label of your CustomFunction to “CF” and use very short/abbreviated variable names.

Hope it helps and best
Axel

1 Like

Thank you!
These workaround work nicely!

1 Like

read_database_customfunction.py (5.8 KB)
Here’s the code for anyone to recycle. :slight_smile:

Note that this CustomFunction will only work with the SQL-Module installed. Otherwise the pyodbc-Module of the built-in python is not available.

2 Likes

Great, thanks for sharing!